GIS Mapping Tools and How They Work
GRADUATE STUDIES | 3 MIN READ
Geospatial technology is a rapidly growing field, with a toe-hold in dozens of careers, including urban planning, law enforcement and national defense. A key to understanding this field is to understand the GIS mapping tools being used and, fundamentally, how they work.
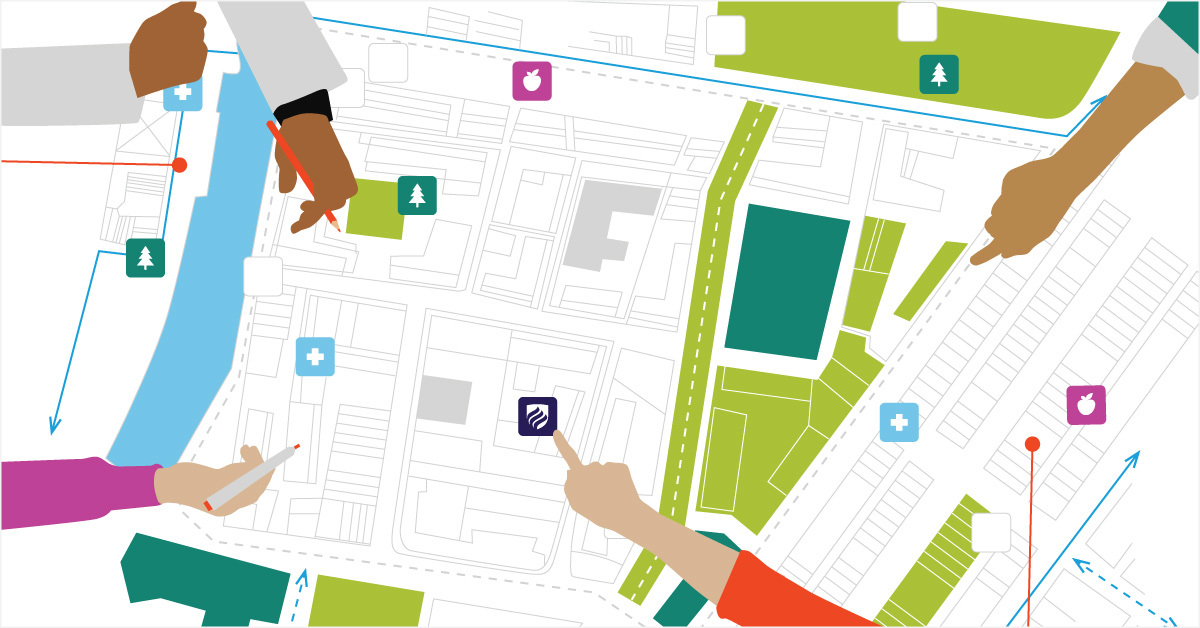
Geographic information systems use dynamic, customizable maps to explore, understand and analyze all sorts of location-based data. Maps can clarify how humans, animals, infrastructure, landforms and weather interact.
Creating those maps requires some skills. And not a little technology: remote sensors, GPS, drones, cellphones and other mobile devices, stationary monitors.
Then you have the intangibles, the qualities you pick up in school and on the job. Visualizing data in a meaningful way. Seeing patterns in numbers. Understanding scale. Layering one type of information on top of another to create a complete picture.
And these:
- Using symbols
- Measuring distances
- Creating filters to screen data in a variety of ways
- Defining a bounding region with buffers
- Classifying with raster maps
- Understanding topology, geocoding and modeling
- Collecting data
Editing and managing data is a key part of GIS mapping. Creating a selection set lets you extract features to make a new data set or aggregate attributes. Being able to digitize new features further enhances data.
Anyone who dives into geographic information systems will quickly become familiar with the multitude of tools available to store, retrieve, manage, display and analyze all types of geographic and spatial data.
GIS software lets you produce maps and other geographic displays to analyze and present information. The displays typically include points, lines, areas or raster images (from photos or scanned images).
Getting Started with GIS Mapping Tools
GIS maps allow a company or organization to find and display meaningful spatial patterns in data. It’s a big toolbox, and the tools are often used simultaneously. So where to start?
Go back to basics.
Think about what problem you are looking to solve. That will help you determine where to focus your efforts. GIS mapping tools are often divided into four categories: desktop, web, server and specialized.
Some tools—such as Esri ArcGIS Pro, Esri Story Maps, and QGIS—are the most commonly used.
- ArcGIS, produced by Esri, is the flagship product and one of the most widely used in GIS mapping, including ArcGIS Online, which transports desktop mapping into a web environment.
- QGIS is a free, open-source tool, which makes it very accessible and popular among mappers.
- Esri Story Maps, another free program, provides context and supporting information, so it can be a stand-alone resource.
All three of these applications can be used to:
- Transform data into a map
- Perform queries and visualizing the results
- Connect a spreadsheet with map data
- Geocode addresses
- Edit attribute data and geometry
With desktop applications, you can add layers — styled as a stroke, fill or label — to maps to make comparisons. You can also create selection sets, which allow you to manipulate or highlight just one part of a map, to pull out details.
Hands-On Experience with GIS Mapping Tools
Looking to delve deeper into GIS mapping tools and advance your career prospects in the field? As a M.S. in Geographic Information Systems (GIS) student at Elmhurst University, you have free access to professional GIS software from any computer with an internet connection. This gives you high-end processing power from a regular computer.
Request more information today!