Can Data Science Predict NCAA Football TV Ratings?
UNLIMITED DATA | BY JAMES KULICH | 6 MIN READ

This year’s football season has ended, but it provided a good spark for an interesting project—one that could have implications for predicting NCAA football TV ratings.
The author of the project is one of our Master’s in Data Science students at Elmhurst University, Michael McComiskey. While Mike currently works in IT, he spent 25 years in the world of college athletics.
Mike’s overall goal was to create a tool that a television programmer could use to predict whether a particular college football game would be a “good” matchup from a viewership perspective. Mike’s initial definition of “good” was any game with TV viewership at least two standard deviations above the median for the time frame in question.
However, a quick look at some data and some careful thought about what a network TV executive might actually find useful led Mike down a different path.
Finding the Value in Football Viewership Numbers
First, the data:
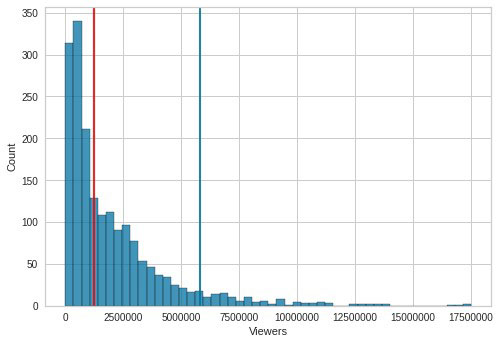
The red line in the chart above represents the median number of viewers of the games Mike considered, and the blue line represents the viewership level two standard deviations above this median.
There aren’t many games at the high end, and, you don’t need a predictive model to identify them. Networks already give prime-time billing to marquee matchups like Ohio State vs. Michigan or Auburn vs. Alabama.
The potential for new value lies with choosing less obvious matchups likely to still have strong viewership. Mike focused his work on predicting contests that would lie between the red and blue lines, those having more the median number of viewers but that fell below the two standard deviation threshold.
Getting the Right Data and Getting the Data Right
Mike’s knowledge of the field led him to a number of good data sources such as Sports Media Watch and Sports Reference. As is usually the case, Mike needed to do substantial work, including developing some custom code, to bring the data together and put it into a useable form.
Some originally available data fields included each contest’s date, time, broadcast network, home and away teams, conference affiliations, AFP and AP rankings, NCAA football TV ratings, and number of viewers.
The raw data did not lend itself well to model development. Significant feature engineering was necessary to create new quantities that better represented the story within the data. Here’s where Mike’s deep domain experience proved to be especially useful.
Mike created new variables to capture important nuances of the matchups involved, such as whether a game had at least one participant from the major conferences—Big Ten, Big 12, Pac-12, SEC—or the Football Championship Subdivision.
Other new variables captured cases where both participants were from a Power Five conference (ACC, Big Ten, Big 12, Pac-12 or SEC), or cases where teams were from the Football Bowl Subdivision but not from one of the A5 conferences.
Other new features were built to capture ranking information in enough detail to be useful (but not so much detail as to cause clutter), such as matchups in the top two, top five, top 10, top 15 and top 25.
A third set of new features focused on the time windows for games: early afternoon, late afternoon, prime time, or late prime.
The Results
With these new features in place, models could now be developed to capture the signals in the data. Mike used the semi-automated capabilities of PyCaret and arrived at a collection of candidate models with strong performance characteristics.
One measure of model performance is the ROC curve, which gives a sense of how much better than random guessing models perform as a whole. The farther a model’s ROC curve is above the diagonal line, the quicker it makes quality predictions.
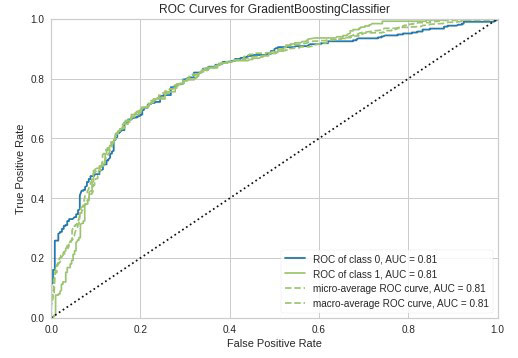
These ROC curves show that Mike’s candidate models were consistently performing at high levels of predictive power.
Going deeper, Mike’s models identified the relative importance of the variables used to generate the predictions. At the top of the list was a matchup between top 25 schools. SEC matchups showed more potential for being at the targeted viewership level than other conference games, although other major conference rivalries showed positive impact.
Interestingly, the time of a game was not an important variable. Who was playing mattered more than when they played.
As a final test, Mike applied his chosen tuned Gradient Boosting Classifier model to some fresh data with known answers. Accuracy, recall and precision all remained high, with accuracy reaching 78%.
Refining the Model
As always, there are possibilities for improvement. One direction Mike proposed is flagging teams with widespread name recognition to measure the impact of reputation on viewership. Other possible inputs Mike suggested included traditional success records or some form of a love/hate index developed from viewers.
There is plenty of ongoing conversation about future directions data science may take. One point expressed by Maria Korolov in her CIO blog post, How to Know When AI is the Right Solution, is that simpler methods should be used when they are effective, leaving more powerful AI approaches for situations where they can lead to noticeably better business value.
This is precisely the approach Mike took in his work by focusing on the challenging problem of selecting mid-tier games that have high potential to generate interest among viewers. Indeed, this emphasis on doing projects that matter is how we approach our entire Masters in Data Science program at Elmhurst University.
As an instructor and as the program’s director, I am especially gratified when students like Mike do especially fine work.
Start Your Passion Project at Elmhurst University
Elmhurst University’s Data Science and Analytics program helps professionals excel in business. Meanwhile, our flexible online format allows you to earn a master’s degree on your terms. Ready to learn more? Complete the form below.